COSMIC PATTERNS SOFTWARE, INC.| SAMPLE REPORTS PAGE
| SIRIUS | KEPLER | PEGASUS | REPORT OPTIONS | ARTWHEEL CD | MEGA ATLAS | PURCHASE | NEW REPORTS | CONTACT US |

![]() The
Gold Forecast by David
Cochrane
The
Gold Forecast by David
Cochrane
| THE
GOLD FORECAST BY
DAVID COCHRANE: Optional Report Option of Sirius |
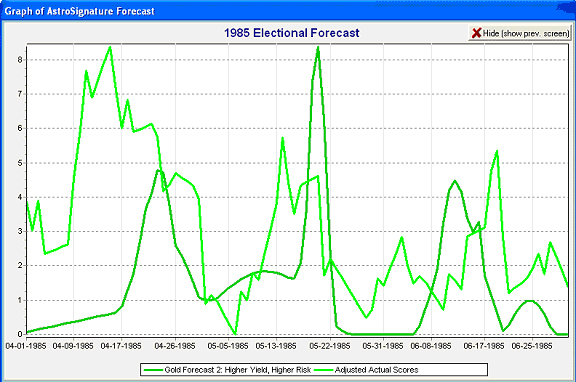
The Gold Forecast Report can be used by financial astrologers, financial consultants and researchers who are interested in pursuing astrological variables as a possible additional factor, and astrological researchers of any area who wish to get a better appreciation for an AstroSignature that has been developed with the help of actual empirical research, rather than only assumptions and anecdotal evidence. Sirius has the ability to produce a graph of predicted behavior, actual behavior, the correlation between the predicted and actual behavior, and whether the correlation is statistically significant. The behavior must be quantifiable and preferably scored at reasonably regular intervals. Price data is a good example of this behavior. Another example would be athletic performance, such as batting average or on-base average of a baseball player for each game played. Sirius also provides extensive research tools to discover an AstroSignature that has statistical significance. The Gold Forecast AstroSignature was developed using these tools. Shown below is a graph of gold prices predicted by the Gold Forecast AstroSignature and the actual prices. This is a graph produced in Sirius, and this is an example of the graph that you can produce for future time periods if you obtain from a financial data service recent gold prices.
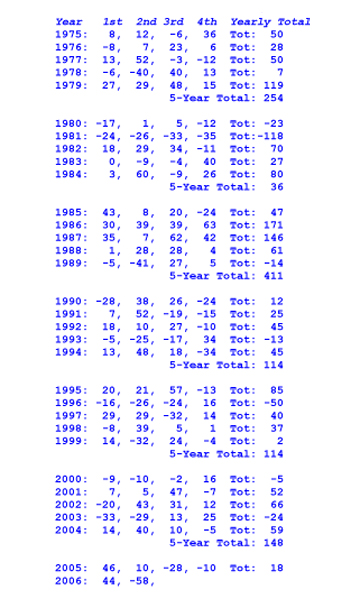
As you can see from the legend shown below the graph, the dark green line is the forecasted prices and the light green line is the actual scores adjusted to fit within the range of predicted socres so that the graphs can be easily compared. In Sirius there are additional windows that can be accessed while viewing this graph: there is a window for viewing the daily scores and the astrological influences in effect for each day, so that you can see the specific details that contribute to the resulting graph. This window of details is very helpful for analyzing and understanding the astrological influences that are in effect at any given time. Also displayed is the correlation value between the predicted and actual scores. For the above graph the correlation is .08 (positive 8 percent). Although an 8 percent correlation may not seem very high, visually you can see that there are some general similarities between the predicted and actual graphs. If you purchase the Gold Forecast Report, you can select the “Customize/View AstroSignature” button to view the details of the AstroSignature. You can do this for both the high risk/high yield and for the low rish/low yield AstroSignatures. Note that the high risk/high yield AstroSignature is very similar to the low risk/low yield AstroSignature and the risk and yield of the two AstroSignatures, although different, is only slightly different. The high risk/high yield forecast has an average correlation of about 9% with actual prices, and slightly greater variability that the low risk/low yield forecast which has about an 80% correlation. ACCURACY: Shown below are the correlations obtained (in percent values rather than decimal values) for the “Higher Yield, Higher Risk” AstroSignature provided with the Gold Forecast Report option of Sirius for the years that the gold prices are available:
SUMMARY OF RESULTS: There are 79 positive correlations and 47 negative correlations. There are 38 statistically significant positive correlations and 15 statistically significant negative correlations at the .05 level or higher. At the .01 level of significance there are 24 statistically significant positive correlations and 7 statistically significant negative correlations. The average correlation, calculated as the average of the correlations listed above, is 8.6% Most importantly, a calculation of the average correlation using
the Fixed Effects Model in the Zumastat 4.0 statistics software
(www.zumastat.com) produced the following results: Are the results spurious?
Given these restrictions applied in the research, the gold forecast formula and the pursuit of AstroSignatures for forecasting commodity prices deserves additional research, and may prove to have a viable and sound scientific basis despite the current skepticism in the scientific community that planetary positions can have any relationship to terrestrial behavior other than via gravity or other mechanisms already identified and understood. The Gold Forecast is a sincere and impressive step in developing objective validation of astrology and applying astrology in a realistic and reliable way to financial forecasting. The Gold Forecast, however, has not been validated and replicated by additional research and therefore, from a scientific point of view, must still be considered speculative. Note that the reason why research is conducted is to understand something that was previously not understood. The Gold Forecast, and the research cited above which is based on similar principles, represents a step towards greater understanding. |